GPU MODE Lecture 8: CUDA Performance Checklist
- GPU MODE Lecture Notes: My notes from the GPU MODE reading group lectures run by Andreas Kopf and Mark Saroufim.
- Introduction
- The Importance of SRAM
- CUDA Performance Tricks
- Memory Latency and the Roofline Model
- Case Study 1: Coalescing Global Memory Accesses
- Case Study 2: Maximizing Occupancy
- Understanding Memory vs. Compute Bound Workloads
- Case Study 3: Minimizing Control Divergence
- Case Study 4: Thread Coarsening
- Case Study 5: Privatization
- Case Study 6: Rewriting Algorithms with Better Math (Flash Attention)
- Conclusion
- YouTube Recording: Lecture 8: CUDA Performance Checklist
- Slides: CUDA Performance Checklist
- Code: lecture_008
- Lightning AI Studio: CUDA Mode Lectures
Introduction
- Mark Saroufim, an engineer on the PyTorch team at Meta, presents a re-recorded talk on CUDA performance checklist.
- This talk is a direct sequel to Lecture 1, which focused on the importance of GPU performance.
- This lecture covers common tricks to improve CUDA and PyTorch performance.
- The content follows a profiling-first approach, using NCU (an NVIDIA CUDA Profiler) to validate hypotheses.
- Running the examples requires a GPU; cloud vendor setup for NCU can be tricky.
- Lightning AI Studio is recommended for cloud-based execution as NCU is already set up.
- Technical Report: Dissecting the NVIDIA Volta GPU Architecture via Microbenchmarking
# Allow access for any user (restart required)
echo 'options nvidia NVreg_RestrictProfilingToAdminUsers=0' | sudo tee /etc/modprobe.d/ncu-permissions.conf
The Importance of SRAM
- Blog Post: Why SRAM is faster than DRAM
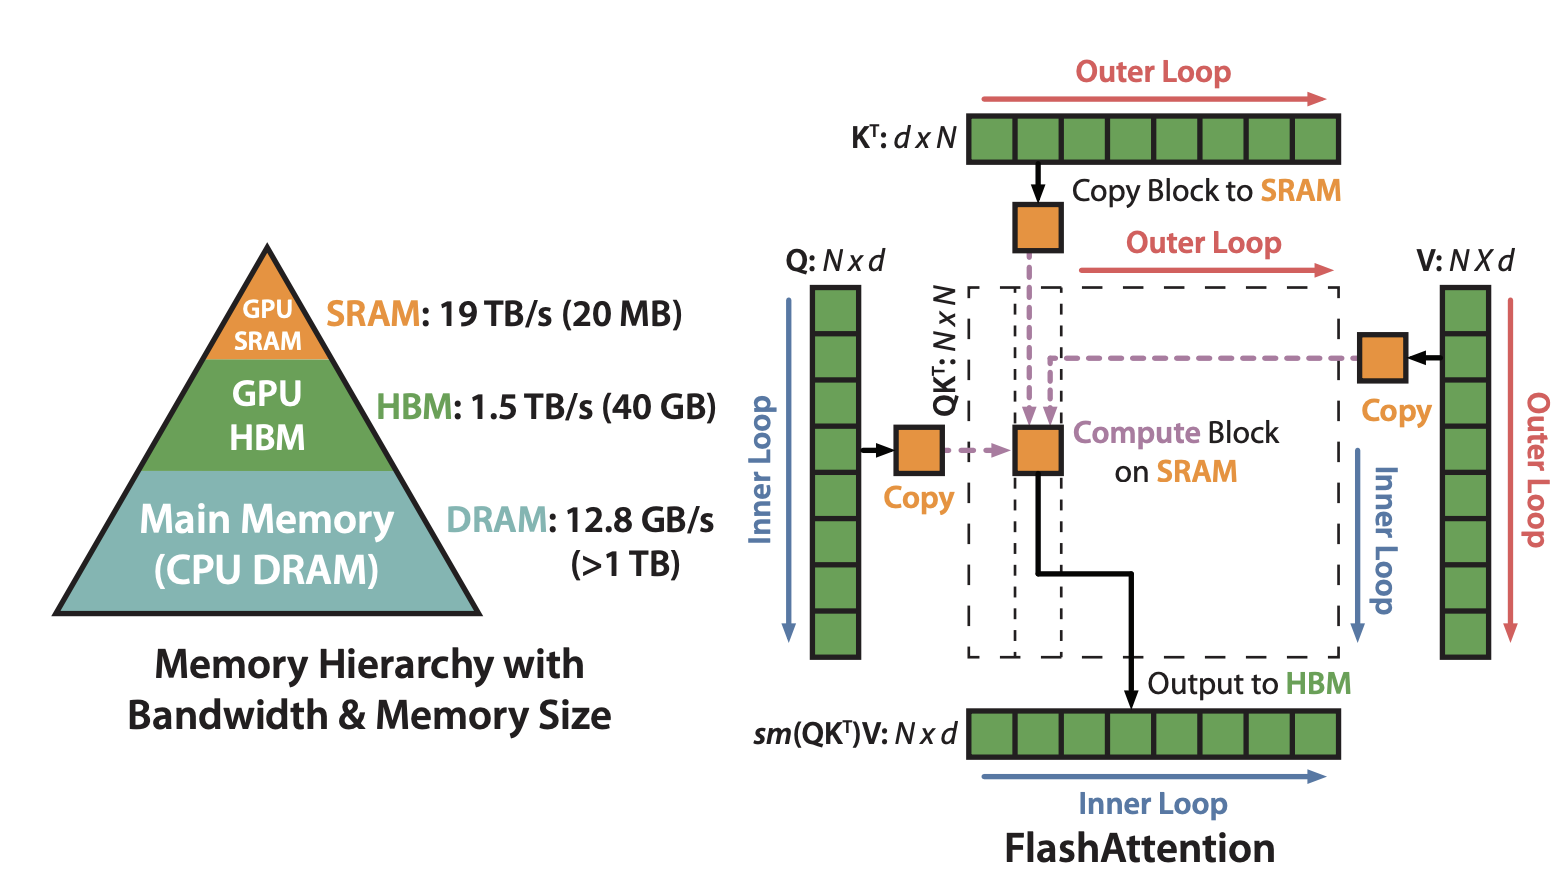
- The primary goal for CUDA performance is to minimize the use of DRAM (slow) and maximize the use of SRAM (fast).
- SRAM (Static RAM): Shared memory, on the order of kilobytes.
- DRAM (Dynamic RAM): Global memory, on the order of tens of gigabytes (e.g., 23GB, 40GB, 80GB).
- SRAM is physically larger, more expensive (3-6x), and generates more heat than DRAM, limiting its size on GPUs.
- Bill Dally (Chief Scientist at NVIDIA) provides insightful explanations of GPU architecture in his talks (recommended).
- Key takeaway: While hardware limitations exist, we can leverage software tricks to improve performance.
CUDA Performance Tricks
- Coalescing global memory accesses: Ensuring contiguous memory access for efficient data transfer.
- Maximizing occupancy: Optimizing thread block and grid sizes to fully utilize GPU resources.
- Understanding memory or compute bound workloads: Identifying the bottleneck (memory bandwidth or compute capability) to guide optimization strategies.
- Minimizing control divergence: Ensuring threads within a warp execute similar instructions to avoid idle time.
- Tiling of reused data: Storing frequently accessed data in shared memory (SRAM) for faster access (covered in Lecture 5).
- Privatization: Utilizing local copies of data to minimize global memory accesses.
- Thread coarsening: Increasing the workload per thread, particularly beneficial for memory-bound kernels.
- Rewriting algorithms using better math: Employing algorithmic and mathematical optimizations to improve performance (e.g., Flash Attention).
- Most of these tricks are discussed in the “Programming Massively Parallel Processors” (PMPP) book.
Memory Latency and the Roofline Model
- Latency: The time it takes to access a memory location.
- Paper: Demystifying the Nvidia Ampere Architecture through Microbenchmarking and Instruction-level Analysis
- Global memory latency: ~290 cycles (from “Demystifying the NVIDIA Ampere Architecture…” paper).
- L2 cache latency: ~200 cycles.
- L1 cache latency: ~33 cycles (10x reduction compared to global memory).
- Shared memory latency: Similar to L1 cache (23/19).
- GPU memory access is non-deterministic due to the implicit management of L1 and L2 caches.
- “It’s the Latency, Stupid” article: Explains the challenges of reducing latency; throughput can be increased by parallelism, but latency reduction requires fundamental changes.
- Quantization: Reduces latency by using smaller data types (e.g., int8 instead of float32), but may impact accuracy.
- Roofline Model:
- Operational Intensity: (Total operations) / (Total memory accesses)
- X-axis: Operational Intensity.
- Y-axis: Performance.
- Memory-bound workloads: Performance limited by memory bandwidth (low operational intensity).
- Compute-bound workloads: Performance limited by GPU compute capability (high operational intensity).
Case Study 1: Coalescing Global Memory Accesses
Goal: Demonstrate the impact of coalesced vs. non-coalesced memory accesses.
Kernel: Copies data from one memory location to another.
#include <iostream> #include <cuda_runtime.h> __global__ void copyDataNonCoalesced(float *in, float *out, int n) { int index = blockIdx.x * blockDim.x + threadIdx.x; if (index < n) { out[index] = in[(index * 2) % n]; } } __global__ void copyDataCoalesced(float *in, float *out, int n) { int index = blockIdx.x * blockDim.x + threadIdx.x; if (index < n) { out[index] = in[index]; } } void initializeArray(float *arr, int n) { for(int i = 0; i < n; ++i) { arr[i] = static_cast<float>(i); } } int main() { const int n = 1 << 24; // Increase n to have a larger workload float *in, *out; cudaMallocManaged(&in, n * sizeof(float)); cudaMallocManaged(&out, n * sizeof(float)); initializeArray(in, n); int blockSize = 128; // Define block size // int blockSize = 1024; // change this when talking about occupancy int numBlocks = (n + blockSize - 1) / blockSize; // Ensure there are enough blocks to cover all elements // Launch non-coalesced kernel copyDataNonCoalesced<<<numBlocks, blockSize>>>(in, out, n); cudaDeviceSynchronize(); initializeArray(out, n); // Reset output array // Launch coalesced kernel copyDataCoalesced<<<numBlocks, blockSize>>>(in, out, n); cudaDeviceSynchronize(); cudaFree(in); cudaFree(out); return 0; }- Coalesced version: Threads access contiguous memory locations.
- Non-coalesced version: Threads access memory locations with strides (skipping elements).
Benchmark:
# Create a binary called benchmark
nvcc -o benchmark coalesce.cu
# Run the benchmark
ncu benchmark
Metrics: DRAM throughput, L1 cache throughput, kernel duration.
Lecture Results (T4):
Non-coalesced: Lower L1 cache throughput, higher DRAM throughput, slower kernel duration.
Metric Name Metric Unit Metric Value DRAM Frequency cycle/nsecond 4.97 SM Frequency cycle/usecond 581.85 Elapsed Cycles cycle 444595 Memory Throughput % 89.74 DRAM Throughput % 89.74 Duration usecond 764.10 L1/TEX Cache Throughput % 29.51 L2 Cache Throughput % 30.26 SM Active Cycles cycle 443190.15 Compute (SM) Throughput % 25.06 Coalesced: Higher L1 cache throughput, lower DRAM throughput, significantly faster kernel duration.
Metric Name Metric Unit Metric Value DRAM Frequency cycle/nsecond 4.97 SM Frequency cycle/usecond 582.33 Elapsed Cycles cycle 325426 Memory Throughput % 82.13 DRAM Throughput % 82.13 Duration usecond 558.82 L1/TEX Cache Throughput % 36.70 L2 Cache Throughput % 27.57 SM Active Cycles cycle 323347.40 Compute (SM) Throughput % 24.17
Personal Results (RTX 4090):
Non-coalesced:
Metric Name Metric Unit Metric Value DRAM Frequency Ghz 10.49 SM Frequency Ghz 2.23 Elapsed Cycles cycle 458,344 Memory Throughput % 94.34 DRAM Throughput % 94.34 Duration us 205.12 L1/TEX Cache Throughput % 9.52 L2 Cache Throughput % 34.92 SM Active Cycles cycle 414,499.87 Compute (SM) Throughput % 8.31 Coalesced:
Metric Name Metric Unit Metric Value DRAM Frequency Ghz 10.49 SM Frequency Ghz 2.23 Elapsed Cycles cycle 265,803 Memory Throughput % 93.54 DRAM Throughput % 93.54 Duration us 118.98 L1/TEX Cache Throughput % 17.47 L2 Cache Throughput % 31.50 SM Active Cycles cycle 206,343.47 Compute (SM) Throughput % 11.56
Key takeaway: Coalesced memory accesses significantly improve performance, especially for larger inputs.
Case Study 2: Maximizing Occupancy
Occupancy: The ratio of active warps to the maximum number of warps a streaming multiprocessor (SM) can handle.
Tile Quantization: Occurs when matrix dimensions are not divisible by the thread block tile size.
Wave Quantization: Occurs when the total number of tiles is not divisible by the number of SMs.
NCU Warning: Indicates tile or wave quantization issues.
Example: Matrix multiplication with varying inner dimension (k).
- NVIDIA Documentation: Matrix Multiplication Background User’s Guide
Results: Performance can vary significantly (up to 4x) depending on the divisibility of k by the optimal tile size.
Padding: A common technique in PyTorch to ensure matrix dimensions are multiples of optimal values.
Optimal Tile Sizes (from Matrix Multiplication Background User’s Guide):
Tensor Cores can be used for… cuBLAS version < 11.0 cuDNN version < 7.6.3 cuBLAS version ≥ 11.0 cuDNN version ≥ 7.6.3 INT8 Multiples of 16 Always but most efficient with multiples of 16; on A100, multiples of 128. FP16 Multiples of 8 Always but most efficient with multiples of 8; on A100, multiples of 64. TF32 N/A Always but most efficient with multiples of 4; on A100, multiples of 32. FP64 N/A Always but most efficient with multiples of 2; on A100, multiples of 16. - A100 (Tensor Cores): int8 (multiples of 16, 128), FP16 (multiples of 8, 64), TF32 (multiples of 4, 32), FP64 (multiples of 2, 16).
CUDA Occupancy Calculator: A tool that recommends optimal block and grid sizes for a given kernel and hardware.
Example: Using
cudaOccupancyMaxPotentialBlockSizefunction to determine optimal block and grid sizes.#include <iostream> #include <cuda_runtime.h> __global__ void copyDataCoalesced(float *in, float *out, int n) { int index = blockIdx.x * blockDim.x + threadIdx.x; if (index < n) { out[index] = in[index]; } } void initializeArray(float *arr, int n) { for(int i = 0; i < n; ++i) { arr[i] = static_cast<float>(i); } } int main() { const int n = 1 << 24; // Adjust the data size for workload float *in, *out; cudaMallocManaged(&in, n * sizeof(float)); cudaMallocManaged(&out, n * sizeof(float)); initializeArray(in, n); int blockSize = 1024; // Optimal block size for many devices int numBlocks = (n + blockSize - 1) / blockSize; // Calculate the number of blocks // Optimize grid dimensions based on device properties int minGridSize = 40; cudaOccupancyMaxPotentialBlockSize(&minGridSize, &blockSize, copyDataCoalesced, 0, 0); // Print suggested block size and minimum grid size std::cout << "Recommended block size: " << blockSize << ", Minimum grid size: " << minGridSize << std::endl; numBlocks = (n + blockSize - 1) / blockSize; // Launch coalesced kernel copyDataCoalesced<<<numBlocks, blockSize>>>(in, out, n); cudaDeviceSynchronize(); cudaFree(in); cudaFree(out); return 0; }Benchmark:
# Create a binary called benchmark
nvcc -o benchmark occupancy.cu
# Run the benchmark
ncu benchmark
Lecture Results (T4): Significant performance improvement by using recommended block and grid sizes.
Recommended block size: 1024, Minimum grid size: 40Personal Results (RTX 4090):
Recommended block size: 768, Minimum grid size: 256Metric Name Metric Unit Metric Value DRAM Frequency Ghz 10.49 SM Frequency Ghz 2.23 Elapsed Cycles cycle 265,182 Memory Throughput % 93.62 DRAM Throughput % 93.62 Duration us 118.69 L1/TEX Cache Throughput % 17.08 L2 Cache Throughput % 28.70 SM Active Cycles cycle 246,167.14 Compute (SM) Throughput % 11.32 Key takeaway: Maximizing occupancy is crucial for achieving optimal performance, especially for compute-bound kernels.
Understanding Memory vs. Compute Bound Workloads
Memory-bound kernels: Bottlenecked by memory bandwidth.
Compute-bound kernels: Bottlenecked by GPU compute capability.
Operational Intensity: A key metric to determine if a kernel is memory or compute bound.
Operation Arithmetic Intensity Limiter Residual addition 0.166 Memory ReLU activation 0.25 Memory Batch normalization O(10) Memory Convolution 1-10000+ Memory/Math Examples of Arithmetic Intensity Calculation:
- Pointwise Functions (e.g., ReLU):
- Float32: Arithmetic intensity of 1/8 (general case) or 1/4 (best case).
- Float16: Arithmetic intensity of 1/4.
- Matrix Multiplication:
A = [m,n]B = [n,k]: 2mnk / (mn + nk + mk)- Generally compute-bound for larger matrices.
- Can become memory bandwidth bound for very small matrices.
- Pointwise Functions (e.g., ReLU):
Optimizations for Memory-Bound Kernels:
- Fusions: Combining multiple operations into a single kernel to reduce memory accesses.
- Quantization: Reducing data type size to improve arithmetic intensity.
- Compilation: Using compilers like Torch Compiler to optimize memory access patterns and reduce overhead.
Optimizations for Compute-Bound Kernels:
- Algorithm optimization: Rewriting the algorithm with fewer operations or improved mathematical formulations.
Key takeaway: Understanding the bottleneck (memory or compute) is crucial for selecting the right optimization strategies.
Case Study 3: Minimizing Control Divergence
Control Divergence: Occurs when threads within a warp execute different instructions due to conditional statements (if-else).
Warp: A group of 32 threads scheduled together on a SM.
Problem: Divergent threads can lead to idle time and reduced performance.
Example: Kernel with an if-else statement based on even/odd element values.
#include <stdio.h> #include <cuda_runtime.h> __global__ void processArrayWithDivergence(int *data, int N) { int idx = blockIdx.x * blockDim.x + threadIdx.x; if (idx < N) { if (data[idx] % 2 == 0) { data[idx] = data[idx] * 2; } else { data[idx] = data[idx] + 1; } } } __global__ void processArrayWithoutDivergence(int *data, int N) { int idx = blockIdx.x * blockDim.x + threadIdx.x; if (idx < N) { int isEven = !(data[idx] % 2); data[idx] = isEven * (data[idx] * 2) + (!isEven) * (data[idx] + 1); } } void benchmarkKernel(void (*kernel)(int *, int), int *data, int N, const char *kernelName) { int *devData; cudaMalloc(&devData, N * sizeof(int)); cudaMemcpy(devData, data, N * sizeof(int), cudaMemcpyHostToDevice); cudaEvent_t start, stop; cudaEventCreate(&start); cudaEventCreate(&stop); int threadsPerBlock = 256; int blocksPerGrid = (N + threadsPerBlock - 1) / threadsPerBlock; cudaEventRecord(start); kernel<<<blocksPerGrid, threadsPerBlock>>>(devData, N); cudaEventRecord(stop); cudaEventSynchronize(stop); float milliseconds = 0; cudaEventElapsedTime(&milliseconds, start, stop); printf("%s took %f milliseconds\n", kernelName, milliseconds); cudaMemcpy(data, devData, N * sizeof(int), cudaMemcpyDeviceToHost); cudaFree(devData); cudaEventDestroy(start); cudaEventDestroy(stop); } int main() { const int N = 1 << 20; // Example size int *data = (int *)malloc(N * sizeof(int)); // Initialize data for(int i = 0; i < N; i++) { data[i] = i; } benchmarkKernel(processArrayWithDivergence, data, N, "processArrayWithDivergence"); benchmarkKernel(processArrayWithoutDivergence, data, N, "processArrayWithoutDivergence"); free(data); return 0; }- Solution: Rewrite the if-else statement using clever algebra to eliminate branching.
Benchmark:
# Create a binary called benchmark
nvcc -o benchmark divergence.cu
# Run the benchmark
ncu --set full benchmark
Lecture Results (T4): Significant performance improvement (up to 3x speedup) by reducing branch instructions and improving warp efficiency.
With Divergence:
processArrayWithDivergence took 0.074272 millisecondsMetric Name Metric Unit Metric Value Branch Instructions Ratio % 0.18 Branch Instructions inst 98304 Branch Efficiency % 0 Avg. Divergent Branches 0 Without Divergence:
processArrayWithoutDivergence took 0.024704 millisecondsMetric Name Metric Unit Metric Value Branch Instructions Ratio % 0.13 Branch Instructions inst 65536 Branch Efficiency % 0 Avg. Divergent Branches - 0
Personal Results (RTX 4090):
With Divergence:
processArrayWithDivergence took 0.032224 millisecondsMetric Name Metric Unit Metric Value Branch Instructions Ratio % 0.17 Branch Instructions inst 98,304 Branch Efficiency % 0 Avg. Divergent Branches 0 Without Divergence:
processArrayWithoutDivergence took 0.107680 millisecondsMetric Name Metric Unit Metric Value Branch Instructions Ratio % 0.12 Branch Instructions inst 65,536 Branch Efficiency % 0 Avg. Divergent Branches 0
Key takeaway: Minimizing control divergence is important for maintaining high warp utilization and overall performance.
Case Study 4: Thread Coarsening
Thread Coarsening: Increasing the workload per thread, especially beneficial for memory-bound kernels.
Example: Vector addition kernel.
#include <stdio.h> #define N 1024 #define THREADS_PER_BLOCK 256 // This is just an example block size // Original vector addition kernel without coarsening __global__ void VecAdd(float* A, float* B, float* C) { int i = blockIdx.x * blockDim.x + threadIdx.x; if (i < N) C[i] = A[i] + B[i]; } // Vector addition kernel with thread coarsening // Assuming a coarsening factor of 2 __global__ void VecAddCoarsened(float* A, float* B, float* C) { int i = (blockIdx.x * blockDim.x + threadIdx.x) * 2; // Coarsening factor applied here if (i < N) C[i] = A[i] + B[i]; if (i + 1 < N) // Handle the additional element due to coarsening C[i + 1] = A[i + 1] + B[i + 1]; } void random_init(float* data, int size) { for (int i = 0; i < size; ++i) data[i] = rand() / (float)RAND_MAX; } int main() { float *a, *b, *c; float *d_a, *d_b, *d_c; // device copies of a, b, c int size = N * sizeof(float); // Allocate space for device copies of a, b, c cudaMalloc((void **)&d_a, size); cudaMalloc((void **)&d_b, size); cudaMalloc((void **)&d_c, size); // Allocate space for host copies of a, b, c and setup input values a = (float *)malloc(size); random_init(a, N); b = (float *)malloc(size); random_init(b, N); c = (float *)malloc(size); cudaEvent_t start, stop, startCoarsened, stopCoarsened; cudaEventCreate(&start); cudaEventCreate(&stop); cudaEventCreate(&startCoarsened); cudaEventCreate(&stopCoarsened); // Copy inputs to device cudaMemcpy(d_a, a, size, cudaMemcpyHostToDevice); cudaMemcpy(d_b, b, size, cudaMemcpyHostToDevice); // Start timer for VecAdd kernel cudaEventRecord(start); VecAdd<<<(N + THREADS_PER_BLOCK - 1) / THREADS_PER_BLOCK, THREADS_PER_BLOCK>>>(d_a, d_b, d_c); cudaEventRecord(stop); // Wait for VecAdd kernel to finish cudaEventSynchronize(stop); float milliseconds = 0; cudaEventElapsedTime(&milliseconds, start, stop); printf("VecAdd execution time: %f ms\n", milliseconds); // Start timer for VecAddCoarsened kernel cudaEventRecord(startCoarsened); VecAddCoarsened<<<(N + 2*THREADS_PER_BLOCK - 1) / (2*THREADS_PER_BLOCK), THREADS_PER_BLOCK>>>(d_a, d_b, d_c); cudaEventRecord(stopCoarsened); // Wait for VecAddCoarsened kernel to finish cudaEventSynchronize(stopCoarsened); float millisecondsCoarsened = 0; cudaEventElapsedTime(&millisecondsCoarsened, startCoarsened, stopCoarsened); printf("VecAddCoarsened execution time: %f ms\n", millisecondsCoarsened); // Copy result back to host cudaMemcpy(c, d_c, size, cudaMemcpyDeviceToHost); // Clean up cudaFree(d_a); cudaFree(d_b); cudaFree(d_c); free(a); free(b); free(c); cudaEventDestroy(start); cudaEventDestroy(stop); cudaEventDestroy(startCoarsened); cudaEventDestroy(stopCoarsened); return 0; }- Standard version: Each thread handles one element.
- Coarsened version: Each thread handles two elements (coarsening factor of 2).
Benchmark:
# Create a binary called benchmark
nvcc -o benchmark coarsening.cu
# Run the benchmark
ncu benchmark
Lecture Results (T4): Dramatic performance improvement by reducing the number of memory accesses.
Without Coarsening:
VecAdd execution time: 0.235264 msMetric Name Metric Unit Metric Value DRAM Frequency cycle/nsecond 4.70 SM Frequency cycle/usecond 553.39 Elapsed Cycles cycle 2321 Memory Throughput % 0.81 DRAM Throughput % 0.81 Duration usecond 4.19 L1/TEX Cache Throughput % 27.52 L2 Cache Throughput % 0.72 SM Active Cycles cycle 29.07 Compute (SM) Throughput % 0.28 With Coarsening:
VecAddCoarsened execution time: 0.020480 msMetric Name Metric Unit Metric Value DRAM Frequency cycle/nsecond 4.68 SM Frequency cycle/usecond 547.36 Elapsed Cycles cycle 2488 Memory Throughput % 1.10 DRAM Throughput % 1.10 Duration usecond 4.54 L1/TEX Cache Throughput % 38.64 L2 Cache Throughput % 0.74 SM Active Cycles cycle 33.12 Compute (SM) Throughput % 0.26
Personal Results (RTX 4090):
Without Coarsening:
VecAdd execution time: 0.082944 msMetric Name Metric Unit Metric Value DRAM Frequency Ghz 10.19 SM Frequency Ghz 2.17 Elapsed Cycles cycle 4,244 Memory Throughput % 0.67 DRAM Throughput % 0.57 Duration us 1.95 L1/TEX Cache Throughput % 17.10 L2 Cache Throughput % 0.67 SM Active Cycles cycle 52.64 Compute (SM) Throughput % 0.05 With Coarsening:
VecAddCoarsened execution time: 0.008192 msMetric Name Metric Unit Metric Value DRAM Frequency Ghz 10.29 SM Frequency Ghz 2.18 Elapsed Cycles cycle 4,402 Memory Throughput % 0.74 DRAM Throughput % 0.57 Duration us 2.02 L1/TEX Cache Throughput % 29.11 L2 Cache Throughput % 0.74 SM Active Cycles cycle 30.92 Compute (SM) Throughput % 0.04
Note: Larger coarsening factors may not always yield further improvements (Zippy’s experiments in CUDA Mode Discord).
Key takeaway: Thread coarsening can significantly improve performance for memory-bound kernels by reducing memory traffic.
Case Study 5: Privatization
Privatization: Using local copies of data to minimize global memory accesses.
Example 1: Vector addition with private variables.
#include <stdio.h> #include <cuda_runtime.h> // CUDA kernel for vector addition without privatization __global__ void vectorAdd(const float *a, const float *b, float *result, int n) { int index = threadIdx.x + blockIdx.x * blockDim.x; if (index < n) { result[index] = a[index] + b[index]; } } // CUDA kernel for vector addition with privatization __global__ void vectorAddPrivatized(const float *a, const float *b, float *result, int n) { int index = threadIdx.x + blockIdx.x * blockDim.x; if (index < n) { float a_private = a[index]; // Load into private memory float b_private = b[index]; // Load into private memory result[index] = a_private + b_private; } } // Function to initialize the vectors with dummy data void initData(float *data, int size) { for (int i = 0; i < size; ++i) { data[i] = i; } } int main() { int n = 1<<20; // Size of the vectors float *a, *b, *result, *d_a, *d_b, *d_result; // Allocate memory on the host a = (float*)malloc(n * sizeof(float)); b = (float*)malloc(n * sizeof(float)); result = (float*)malloc(n * sizeof(float)); // Initialize vectors initData(a, n); initData(b, n); // Allocate memory on the device cudaMalloc(&d_a, n * sizeof(float)); cudaMalloc(&d_b, n * sizeof(float)); cudaMalloc(&d_result, n * sizeof(float)); // Copy vectors from host to device cudaMemcpy(d_a, a, n * sizeof(float), cudaMemcpyHostToDevice); cudaMemcpy(d_b, b, n * sizeof(float), cudaMemcpyHostToDevice); // Define number of blocks and threads int threadsPerBlock = 256; int blocksPerGrid = (n + threadsPerBlock - 1) / threadsPerBlock; // Launch the vector addition kernel without privatization vectorAdd<<<blocksPerGrid, threadsPerBlock>>>(d_a, d_b, d_result, n); // Copy result back to host cudaMemcpy(result, d_result, n * sizeof(float), cudaMemcpyDeviceToHost); // Launch the vector addition kernel with privatization vectorAddPrivatized<<<blocksPerGrid, threadsPerBlock>>>(d_a, d_b, d_result, n); // Copy result back to host cudaMemcpy(result, d_result, n * sizeof(float), cudaMemcpyDeviceToHost); // Cleanup cudaFree(d_a); cudaFree(d_b); cudaFree(d_result); free(a); free(b); free(result); return 0; }- Vector Addition without Privatization: Directly accesses global memory for each operation.
- Vector Addition with Privatization: Loads data into private variables before performing operations.
Benchmark:
# Create a binary called benchmark
nvcc -o benchmark privatization.cu
# Run the benchmark
ncu benchmark
Lecture Results (T4): No significant performance improvement in this specific example.
Personal Results (RTX 4090):
Not Privatized:
Metric Name Metric Unit Metric Value DRAM Frequency Ghz 10.44 SM Frequency Ghz 2.22 Elapsed Cycles cycle 24,774 Memory Throughput % 77.39 DRAM Throughput % 77.39 Duration us 11.14 L1/TEX Cache Throughput % 11.14 L2 Cache Throughput % 33.19 SM Active Cycles cycle 20,122.48 Compute (SM) Throughput % 8.64 Privatized:
Metric Name Metric Unit Metric Value DRAM Frequency Ghz 10.44 SM Frequency Ghz 2.23 Elapsed Cycles cycle 28,775 Memory Throughput % 80.72 DRAM Throughput % 80.72 Duration us 12.93 L1/TEX Cache Throughput % 11.33 L2 Cache Throughput % 28.59 SM Active Cycles cycle 20,259.88 Compute (SM) Throughput % 8.77
Example 2: Sliding window algorithm using shared memory.
#include <stdio.h> #include <cuda_runtime.h> // Kernel without privatization: Direct global memory access __global__ void windowSumDirect(const float *input, float *output, int n, int windowSize) { int idx = blockIdx.x * blockDim.x + threadIdx.x; int halfWindow = windowSize / 2; if (idx < n) { float sum = 0.0f; for (int i = -halfWindow; i <= halfWindow; ++i) { int accessIdx = idx + i; if (accessIdx >= 0 && accessIdx < n) { sum += input[accessIdx]; } } output[idx] = sum; } } // Kernel with privatization: Preload window elements into registers __global__ void windowSumPrivatized(const float *input, float *output, int n, int windowSize) { int idx = blockIdx.x * blockDim.x + threadIdx.x; int halfWindow = windowSize / 2; __shared__ float sharedData[1024]; // Assuming blockDim.x <= 1024 // Load input into shared memory (for demonstration, assuming window fits into shared memory) if (idx < n) { sharedData[threadIdx.x] = input[idx]; __syncthreads(); // Ensure all loads are complete float sum = 0.0f; for (int i = -halfWindow; i <= halfWindow; ++i) { int accessIdx = threadIdx.x + i; // Check bounds within shared memory if (accessIdx >= 0 && accessIdx < blockDim.x && (idx + i) < n && (idx + i) >= 0) { sum += sharedData[accessIdx]; } } output[idx] = sum; } } void initializeArray(float *arr, int n) { for (int i = 0; i < n; i++) { arr[i] = 1.0f; // Simple initialization for demonstration } } int main() { int n = 1<<20; // Example array size int windowSize = 5; // Example window size float *input, *output; float *d_input, *d_output; input = (float*)malloc(n * sizeof(float)); output = (float*)malloc(n * sizeof(float)); // Initialize input array initializeArray(input, n); // Allocate device memory cudaMalloc(&d_input, n * sizeof(float)); cudaMalloc(&d_output, n * sizeof(float)); // Copy data to device cudaMemcpy(d_input, input, n * sizeof(float), cudaMemcpyHostToDevice); // Setup execution parameters int threadsPerBlock = 256; int blocksPerGrid = (n + threadsPerBlock - 1) / threadsPerBlock; // Execute kernels windowSumDirect<<<blocksPerGrid, threadsPerBlock>>>(d_input, d_output, n, windowSize); cudaMemcpy(output, d_output, n * sizeof(float), cudaMemcpyDeviceToHost); // Copy result back for verification windowSumPrivatized<<<blocksPerGrid, threadsPerBlock>>>(d_input, d_output, n, windowSize); cudaMemcpy(output, d_output, n * sizeof(float), cudaMemcpyDeviceToHost); // Copy result back for verification // Cleanup cudaFree(d_input); cudaFree(d_output); free(input); free(output); return 0; }- Sliding Window Algorithm with Privatization: Utilizes shared memory to store data within the sliding window, reducing global memory traffic.
Benchmark:
# Create a binary called benchmark
nvcc -o benchmark privatization2.cu
# Run the benchmark
ncu benchmark
Personal Results (RTX 4090):
Not Privatized:
Metric Name Metric Unit Metric Value DRAM Frequency Ghz 10.46 SM Frequency Ghz 2.22 Elapsed Cycles cycle 16,441 Memory Throughput % 64.73 DRAM Throughput % 64.73 Duration us 7.39 L1/TEX Cache Throughput % 31.43 L2 Cache Throughput % 32.96 SM Active Cycles cycle 11,401.60 Compute (SM) Throughput % 29.51 Privatized:
Metric Name Metric Unit Metric Value DRAM Frequency Ghz 10.39 SM Frequency Ghz 2.22 Elapsed Cycles cycle 17,959 Memory Throughput % 67.53 DRAM Throughput % 67.53 Duration us 8.10 L1/TEX Cache Throughput % 37.99 L2 Cache Throughput % 28.07 SM Active Cycles cycle 12,130.35 Compute (SM) Throughput % 41.96
Key takeaway: Privatization can be effective, but its impact depends on the specific algorithm and memory access patterns.
Case Study 6: Rewriting Algorithms with Better Math (Flash Attention)
Flash Attention: An example of algorithm optimization for attention mechanisms.
Problem: Traditional softmax calculation in attention requires multiple passes over the data, making it memory-bound.
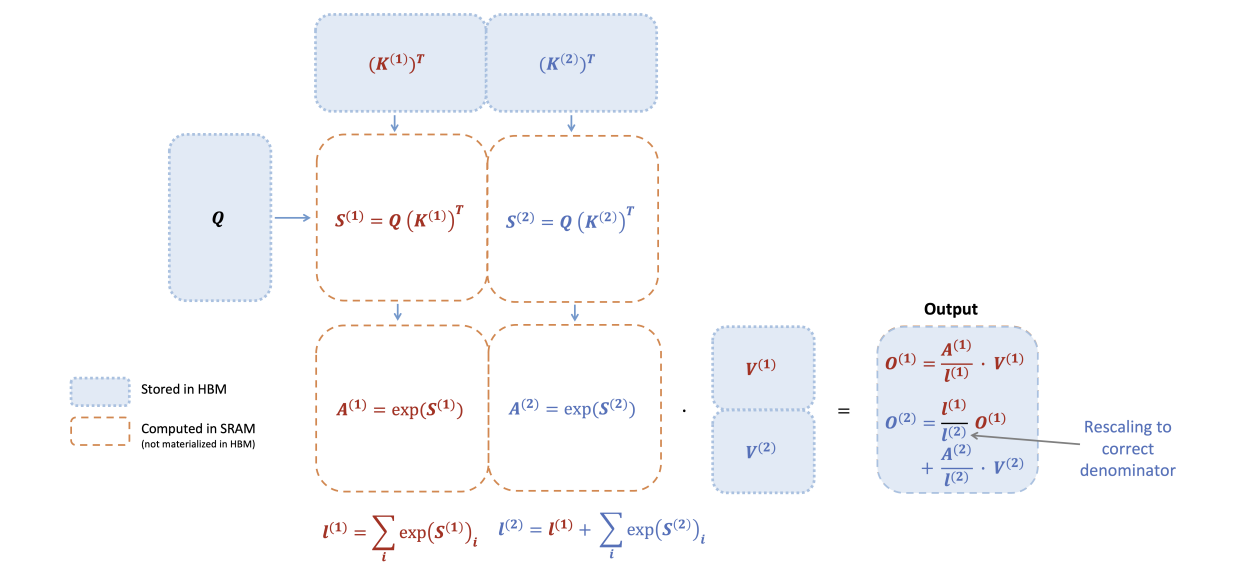
- NoteFlashAttention-2: Figure 1
Figure 1: Diagram of how FlashAttention forward pass is performed, when the key K is partitioned into two blocks and the value V is also partitioned into two blocks. By computing attention with respect to each block and rescaling the output, we get the right answer at the end, while avoiding expensive memory reads/writes of the intermediate matrices S and P. We simplify the diagram, omitting the step in softmax that subtracts each element by the row-wise max.
Original softmax
3 memory accesses per element
- 2 reads
- 1 store
Function: \[ y_i = \frac{e^{x_i}}{\sum\limits_{j=1}^{V} e^{x_j}} \]
Algorithm:
1: d₀ ← 0
2: for j ← 1, V do
3:     d₁ ← dⱼ₋₁ + eˣⱼ
4: end for
5: for i ← 1, V do
6:     yᵢ ← eˣⁱ / d_V
7: end for
Safe softmax:
4 memory accesses per element
- 3 reads
- 1 store
Function: \[ y_i = \frac{e^{x_i - \max\limits_{k=1}^{V} x_k}}{\sum\limits_{j=1}^{V} e^{x_j - \max\limits_{k=1}^{V} x_k}} \]
Algorithm:
 1: m₀ ← -∞
 2: for k ← 1, V do
 3:     mₖ ← max(mₖ₋₁, xₖ)
 4: end for
 5: d₀ ← 0
 6: for j ← 1, V do
 7:     dⱼ ← dⱼ₋₁ + eˣʲ⁻ᵐ_V
 8: end for
 9: for i ← 1, V do
10:     yᵢ ← eˣⁱ⁻ᵐ_V / d_V
11: end for
Solution: Online softmax algorithm:
3 memory accesses per element
- 3 reads
- 1 store
Algorithm:
1: m₀ ← -∞
2: d₀ ← 0
3: for j ← 1, V do
4:     mⱼ ← max(mⱼ₋₁, xⱼ)
5:     dⱼ ← dⱼ₋₁ × eᵐʲ⁻₁⁻ᵐʲ + eˣʲ⁻ᵐⱼ
6: end for
7: for i ← 1, V do
8:     yᵢ ← eˣⁱ⁻ᵐ_V / d_V
9: end for
Maintains a running estimate of the normalization factor.
Corrects the normalization factor locally as new elements are processed. (line 5)
Reduces the number of memory accesses, improving performance.
Key takeaway: Algorithmic and mathematical optimizations can significantly improve performance, especially for compute-bound kernels.
Conclusion
This lecture presented several key optimizations for improving CUDA kernel performance.
Table 6.1 in the PMPP book provides a summary of these optimizations and their impact on compute and memory performance.
Optimization Benefit to compute cores Benefit to memory Strategies Maximizing occupancy More work to hide pipeline latency More parallel memory accesses to hide DRAM latency Tuning usage of SM resources such as threads per block, shared memory per block, and registers per thread Enabling coalesced global memory accesses Fewer pipeline stalls waiting for global memory accesses Less global memory traffic and better utilization of bursts/cache lines Transfer between global memory and shared memory in a coalesced manner and performing uncoalesced accesses in shared memory (e.g., corner turning) Rearranging the mapping of threads to data Rearranging the layout of the data Minimizing control divergence High SIMD efficiency (fewer idle cores during SIMD execution) – Rearranging the mapping of threads to work and/or data Rearranging the layout of the data Tiling of reused data Fewer pipeline stalls waiting for global memory accesses Less global memory traffic Placing data that is reused within a block in shared memory or registers so that it is transferred between global memory and the SM only once Privatization (covered later) Fewer pipeline stalls waiting for atomic updates Less contention and serialization of atomic updates Applying partial updates to a private copy of the data and then updating the universal copy when done Thread coarsening Less redundant work, divergence, or synchronization Less redundant global memory traffic Assigning multiple units of parallelism to each thread to reduce the price of parallelism when it is incurred unnecessarily NCU (NVIDIA CUDA Profiler) is a valuable tool for profiling and understanding kernel performance.
Understanding whether a workload is memory or compute bound is crucial for choosing the right optimization strategies.
CUDA Mode: Represents the mastery of both math and computer science to co-design software with hardware in mind.
I’m Christian Mills, an Applied AI Consultant and Educator.
Whether I’m writing an in-depth tutorial or sharing detailed notes, my goal is the same: to bring clarity to complex topics and find practical, valuable insights.
If you need a strategic partner who brings this level of depth and systematic thinking to your AI project, I’m here to help. Let’s talk about de-risking your roadmap and building a real-world solution.
Start the conversation with my Quick AI Project Assessment or learn more about my approach.